About Stacks Guru
Stacks Guru is born from the need to search the vast number of videos out there on stacks built for Stacks Pro and the Stacks 5 plugin for Rapidweaver.
We have scraped over 500 videos to get the transcripts for each in order to make the spoken word searchable.
Please use this free tool to help you learn and discover the awesome power that Stacks and the stacks made for Stacks have to offer.
Stacks Guru
Video Reference
Pi Gauge Stack Overview
02/06/2025
For more information about Pi, head over to https://www.weavers.space/stacks/pi
Transcript
00:06 [Music]00:10 hey everybody so in this video we're
00:11 going to be looking at one of the great
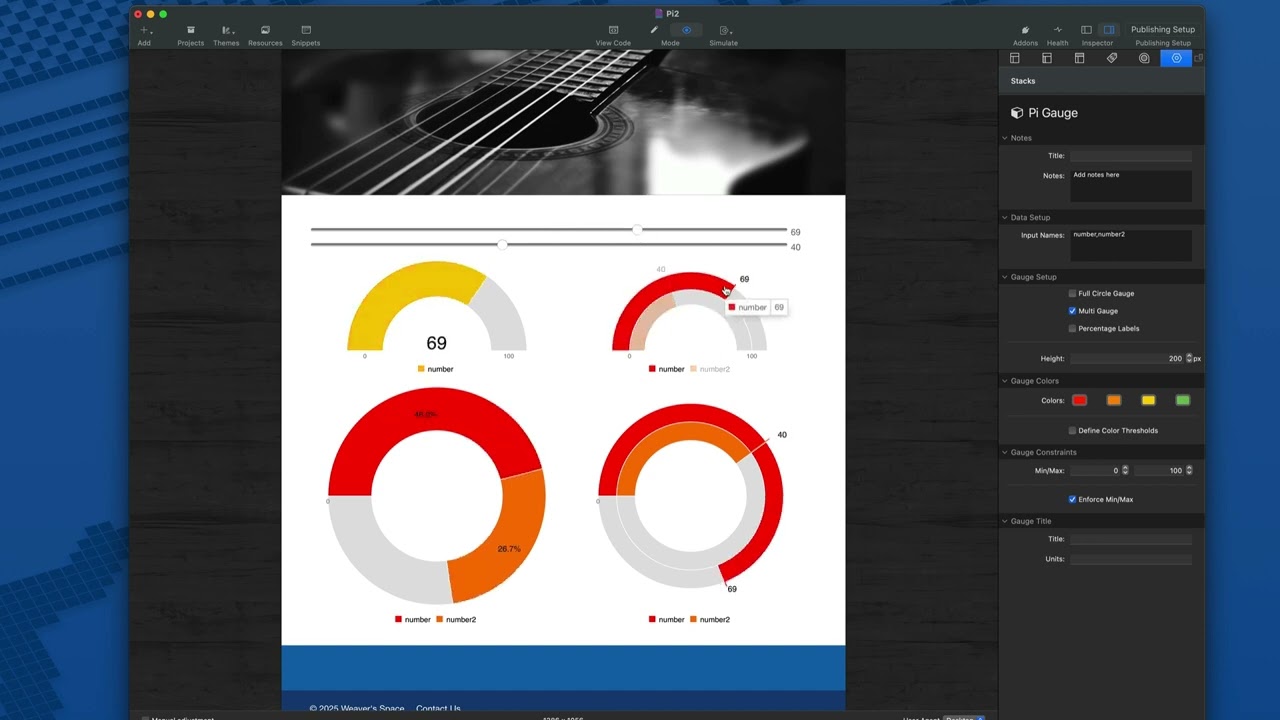
00:13 new features of Pi 2 and that is the new
00:15 Pi gauge stack and as you can see here
00:18 Pi now allows us to display chart data
00:22 from our forms so let's dive in this
00:25 demo is from the pi2 project file and
00:27 we're going to dive into all of these
00:28 examples here so to start up up a top I
00:31 have two slider Stacks um these range
00:33 sliders come from the foundation 6 uh
00:36 you can just use num uh if you don't
00:38 have the foundation 6 forms um and uh
00:42 these are quite styled slightly
00:43 differently because I don't have site
00:44 Styles and whatnot on the page but um
00:46 here I have two sliders um this one is
00:48 just called number and this next one is
00:51 called number two okay and then you'll
00:54 notice that I have a a normal pie stack
00:56 here uh where the field is called
00:58 addition and what that does is that adds
01:01 number plus number two okay um so that
01:04 kind of just shows you the three
01:06 different types of fields or the three
01:08 fields that we have um and let's dive
01:10 into
01:12 gauge so let's look at the simplest
01:14 example here uh at Pi gauge and
01:16 basically what we're going to do is
01:17 we're going to supply the input names
01:21 where the gauge stack is going to get
01:23 our data from so in this particular
01:25 example we're just going to get a single
01:28 uh point of data and that is going to be
01:30 be from the number uh input and that
01:32 again is from the very first range
01:34 slider that has the name of number okay
01:37 and let's just go ahead and preview this
01:40 and you'll notice uh as I change these
01:44 uh sliders here all the values
01:47 change but let's concentrate on this
01:49 first demo here because it only is uh
01:51 reflected with the first slider since we
01:53 only gave it that data
01:55 point first off you'll notice that uh it
01:59 actually colors change based on the
02:02 value which is nice okay and that is
02:05 done further down here where you see we
02:07 can Define four different colors and
02:10 then if you turn on Define color ranges
02:14 it will actually cycle through these
02:16 colors with three different thresholds
02:19 so in this case here we have 30 50 and
02:22 80 so when the number is below 30 it's
02:24 going to be red as we see here it's
02:27 going to go red uh and as we go above 30
02:30 it then turns orange which is the second
02:33 color that we've defined here when we
02:35 surpass 50 it's going to go to Yellow as
02:38 you see there and then when when we
02:40 surpass 80 it's going to go green okay
02:44 so that's kind of how the colors are
02:45 defined uh now if you don't Define
02:47 thresholds essentially um the first data
02:50 point is going to be always going to be
02:52 red okay and then you if you have up to
02:54 four data points um within the gauge
02:57 they'll each subsequent data point we'll
03:00 use the different
03:01 color now if we look at this SEC second
03:04 example here um I have this I changed to
03:06 the settings on this side you'll see
03:08 that that one actually uses two
03:10 different data points it uses the data
03:13 point from slide number one which you'll
03:15 notice is red and if you use the data
03:17 point for slide number two um it is
03:20 orange and the reason for that again the
03:22 colors go in order that you defined here
03:25 so this is data point number one 2 3 and
03:28 four so that's how what the um colors
03:30 are defined when you don't have
03:32 thresholds defined when you do Define
03:35 thresholds in this case you'll notice
03:36 that the colors basically go with the
03:45 thresholds now in this case you'll
03:46 notice because we have two data points
03:48 here I have a comma delimited list of
03:52 the data that we're going to be using so
03:55 here I have number and number two and
03:58 you'll notice that those are actually a
04:00 part of the legend for this um chart and
04:03 what's kind of nice is you can actually
04:04 click on them to show and hide um the
04:07 actual data point and if you hover over
04:09 it it highlights that particular data
04:11 point as well which is
04:14 nice some of the other settings here are
04:16 going to be super easy to understand uh
04:18 we have full circle gauge which gives us
04:20 again the obviously the full circle uh
04:23 we have the multi- gauge which was
04:25 enabled here you'll notice when I turn
04:27 on and off the multi- gauge you'll
04:30 notice when I turn off the multi-gauge
04:32 instead of um each individual uh data
04:35 point having its own arc um they're
04:38 merged into a single
04:39 Arc now if we were to use percentage
04:42 labels like we see here instead of
04:44 displaying the raw data it is going to
04:46 show you the percentage of the total
04:48 that that data
04:50 represents the height allows us to
04:53 control the height of this so basically
04:55 based on the height it'll also control
04:57 the
04:58 width now now the gauge constraints here
05:01 um this allows your minimum and maximum
05:04 values and if you have in force min max
05:08 turned on that means no matter what so
05:12 let's say I go all the way
05:14 to 100 so this first uh slider is set to
05:20 100 this second slider is set to 10 now
05:23 the total for this is actually 110 so as
05:26 you see here by enforcing the Min and
05:27 Max it's not going to allow this to
05:30 expand let's turn that off so that you
05:32 can see what's going to happen so I'm
05:33 going to turn off enforcement Max and
05:36 what we'll see now is as I grow this
05:39 okay you'll notice that the total
05:41 actually grows as
05:44 well right so you see that the maximum
05:46 value here grows uh along with the
05:49 values that you've changed in the
05:56 slider now next for title and units this
05:58 is kind of like a title kind of like a
06:00 subtitle right so we can do uh chart and
06:04 um let's say I PX something like that
06:07 right so in this value here we can we
06:09 can basically kind of put a title and a
06:11 subtitle there um for our
06:14 chart now I want I wanted to show you
06:16 how you can actually use um the addition
06:19 or piie within your charts as well so in
06:23 this one I'm actually going to go ahead
06:24 and add number number two and addition
06:28 okay so now we're going to have three
06:30 data points I turned on Full Circle
06:32 gauge we have multiple arcs so we have
06:34 multiple gauges um I'll turn off percent
06:37 label we'll have our height we'll just
06:38 keep the colors as the defaults with no
06:40 thresholds and I change the Min and Max
06:43 to be
06:44 300 okay let's have a
06:47 look so now we'll notice that we have
06:50 three data points and as I change these
06:55 um they're going to modify dynamically
06:58 and what you notice we have 50 69 and
07:01 then addition which actually isn't a
07:02 part of here it's part of that Pi
07:04 calculation is the addition of number
07:08 and number
07:09 two so as I modify and increase these
07:13 values we will see that the addition
07:16 line is always going to be this plus
07:19 that pretty cool
07:29 oh
Search the page
0